EXPORT PERFORMANCE 2021-22
During the financial year 2021-22, India exported 13,69,264 MT of Seafood worth US$ 7.76 Billion which is all time high exports by value. USA and China are the major importers of Indian seafood. Frozen Shrimp continued to be the major export item.
Export summary are given in the Table.1
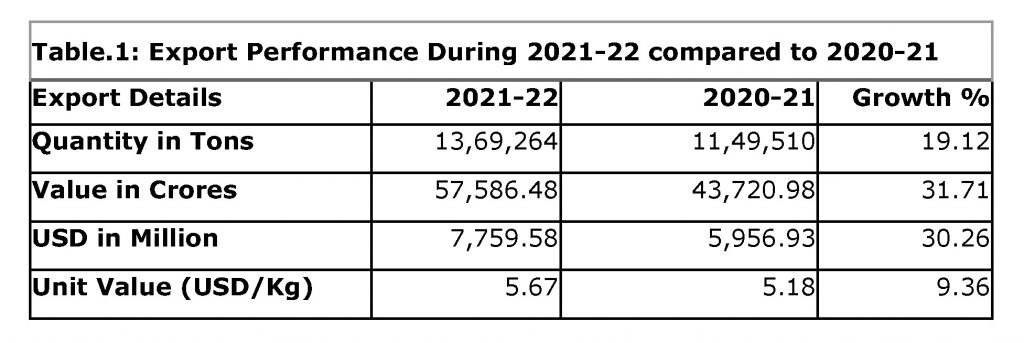
Despite heavy odds the seafood sector performed exemplarily during 2021-22. The seafood export during the year has increased by 31.71% in rupee value terms, 30.26% in US dollar value terms and 19.12% in quantity terms. The unit value also increased 9.36% from 5.18 to 5.67.
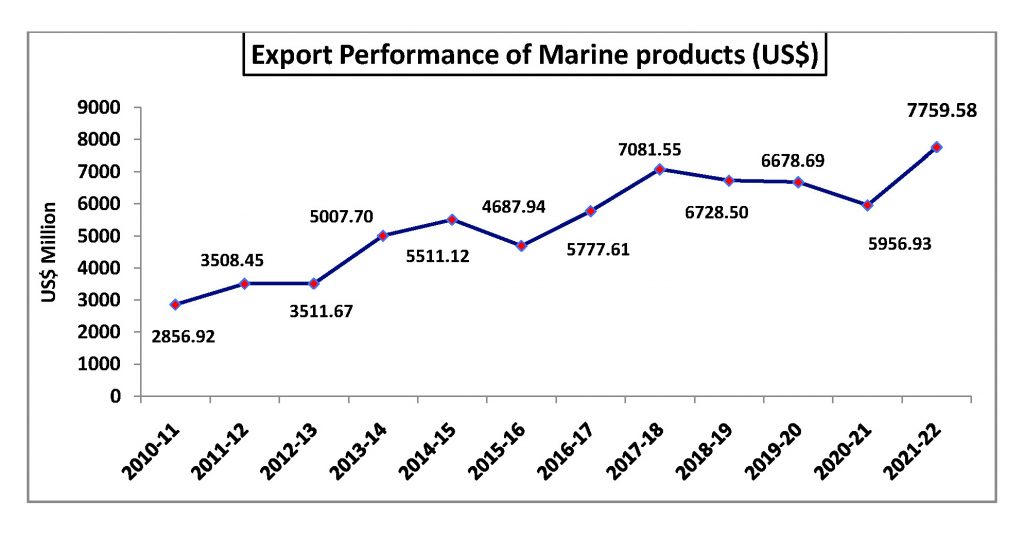
The export performance of marine products since 2010-11 is given in Figure 1.
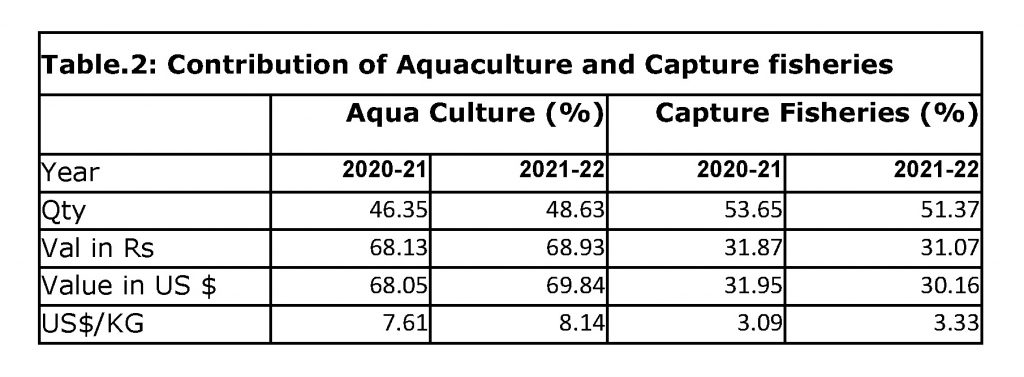
Aquaculture sector has performed better this year as evident from the figures given in Table.2. The aquaculture sector has contributed 69.84% of exported items in terms of US$ and 48.63% in terms of quantity which is 1.79% and 2.28% respectively more when compared to 2020-21. The % share of aquaculture products had shown increase for both quantity and US$ value in 2020-21 also. Capture fisheries contribution reduced from 53.65% to 51.37% in terms of quantity and reduced from 31.95% to 30.16% in terms of US$ value. The unit value of aquaculture products increased by marginal value 0.53 US$/kg from 7.61 to 8.14 US$/kg and the unit value of capture fisheries items also increased marginally from 3.09 to 3.33 US$/kg.
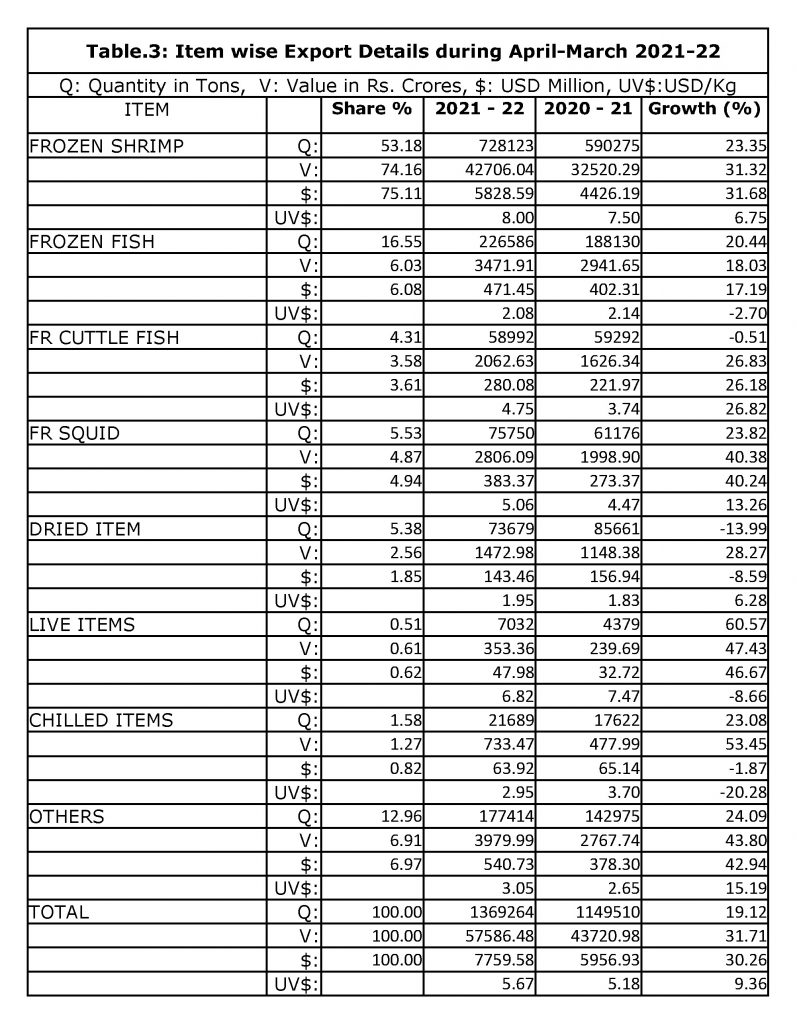
Major Item wise exports details
Frozen shrimp continued to be the major item of export in terms of quantity and value, accounting for a share of 53.18% in quantity and 75.11% of the total USD earnings. The Unit value increase of frozen shrimp was observed at 6.75% from 7.5 to 8 and Shrimp exports during the period increased 31.68% by US$ value, 31.32% by rupee value and 23.35% by quantity.
The overall export of shrimp during 2021-22 was to the tune of 7,28,123 MT worth USD 5,828.59 Million which is all time high for both quantity and value. USA is the largest importer (3,42,572 MT) of frozen shrimp followed by China (1,25,667 MT), European Union (90,549 MT), South East Asia (44,683 MT), Japan (38,492 MT), Middle East (37,158 MT) and Other Countries (49,002 MT).
The export of Vannamei shrimp has increased 25% from 5,15,907 MT to 6,43,037 MT in 2021-22. Out of the total Vannamei shrimp exports, in USD value terms, about 59.05% was exported to USA followed by 14.59% to China, 8.16% to European Union, 4.78 % to South East Asia, 3.61 % to Japan, 3.17 % to Middle East and 6.64% to Other Countries. For Black Tiger shrimp also USA is the major market with a share of 25.90% in terms of USD value followed by EU (23.78%), Japan (22.71%) and Middle East (9.17%) , South East Asia (8.53%), China (3.86%) and Others (6.05%).
Similarly Black tiger shrimp exports also drastically increased 76% from 9,819 MT to 17,231 MT due to the increased production of black tiger during 2021-22 period.
Other Items constituted by Surimi and Surimi analogue (imitation) products was the second largest category by US$ value that shown a growth of 43.80%, 42.94% and 24.09% by rupee, US$ value and quantity. Surimi and surimi analogue products contributed 69.85% in quantity and 56.55% by value in other items category.
Frozen Fish is at the third largest position, accounting for a share of 16.55% in quantity and 6.08% in USD earnings. This year the export of Frozen fish has increased by 20.44%, 18.03% and 17.19% in Quantity, rupee and USD value terms respectively.
Frozen squid has shown a positive export trend of 40.38%, 40.24% and 23.82% in terms of rupee value, value USD earnings, and quantity respectively. Unit value of realization has been increased by 13.26% from 4.47 to 5.06.
Frozen Cuttlefish has shown a growth of 26.83% in value rupee terms and 26.18% in value USD terms. Unit value realization has also been increased by 26.82% from 3.74 to 4.75.
Dried items shown an increase of 28.27% by rupee value but declined by 8.59% in US$ value terms. Unit value of dried items has positively increased by 6.28% from 1.83 to 1.95
Chilled items has shown an increase of 23.08% and 53.45% in terms of quantity and rupee value but in USD terms it is decreased by -1.87%.
Live Items have shown a positive export trend of 60.57%, 47.43% and 46.67% in terms of quantity, rupee and USD value respectively mainly due to the increased exports of ornamental fish.
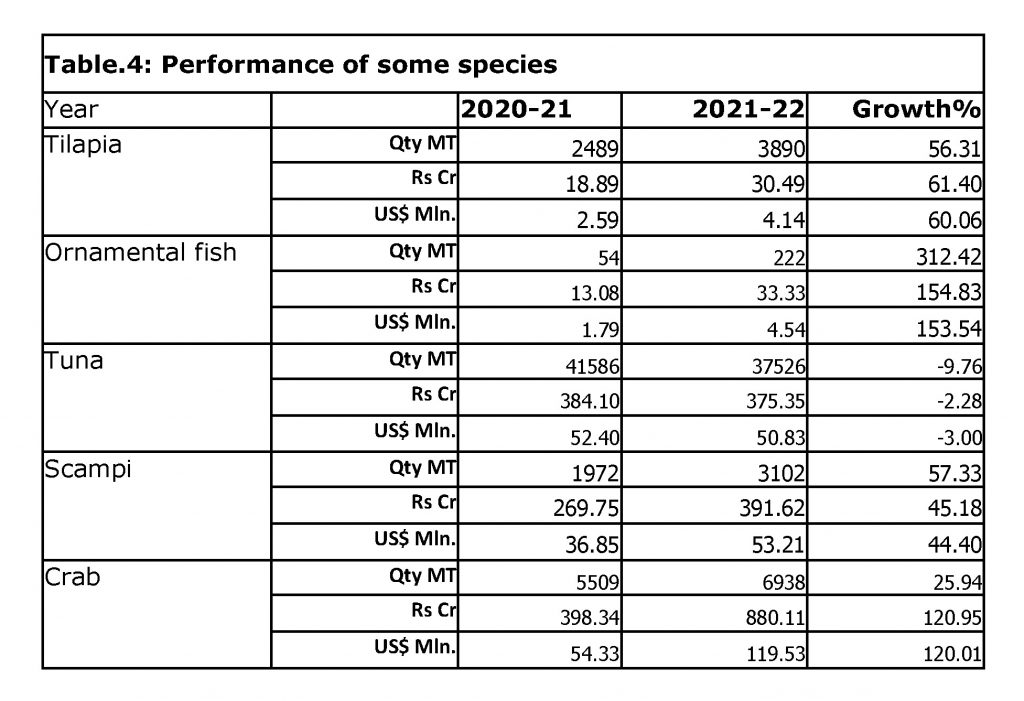
The details of major items of exports are given in the Table.3
It is pertinent to note that Tilapia and Ornamental fish has performed well with 56.31% and 312.42% increase respectively in quantity and 60.06% and 153.54% respectively increase in US$ earnings. Scampi exports shown growth of 57.33%, 45.18% and 44.40% in terms of quantity, rupee and US$ respectively. Crab exports (excluding imitation products) also shown growth of 25.94%, 120.95% and 120.01% in terms of quantity, rupee and US$ respectively.
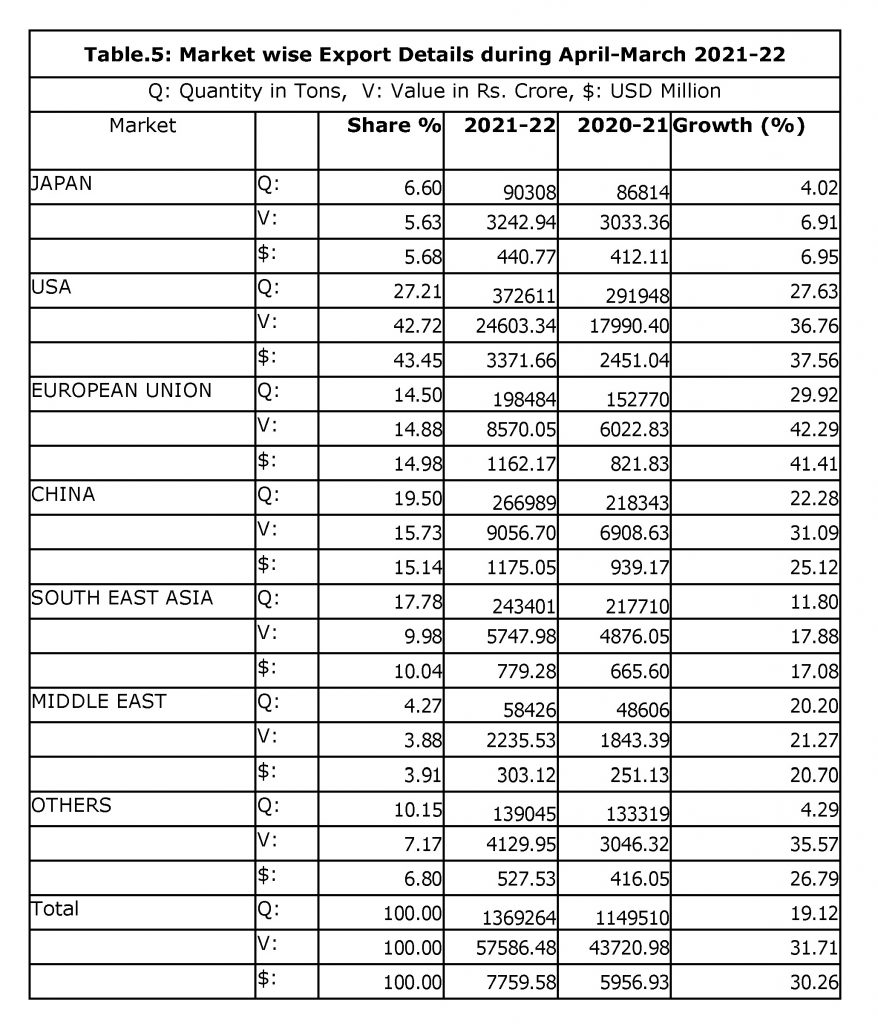
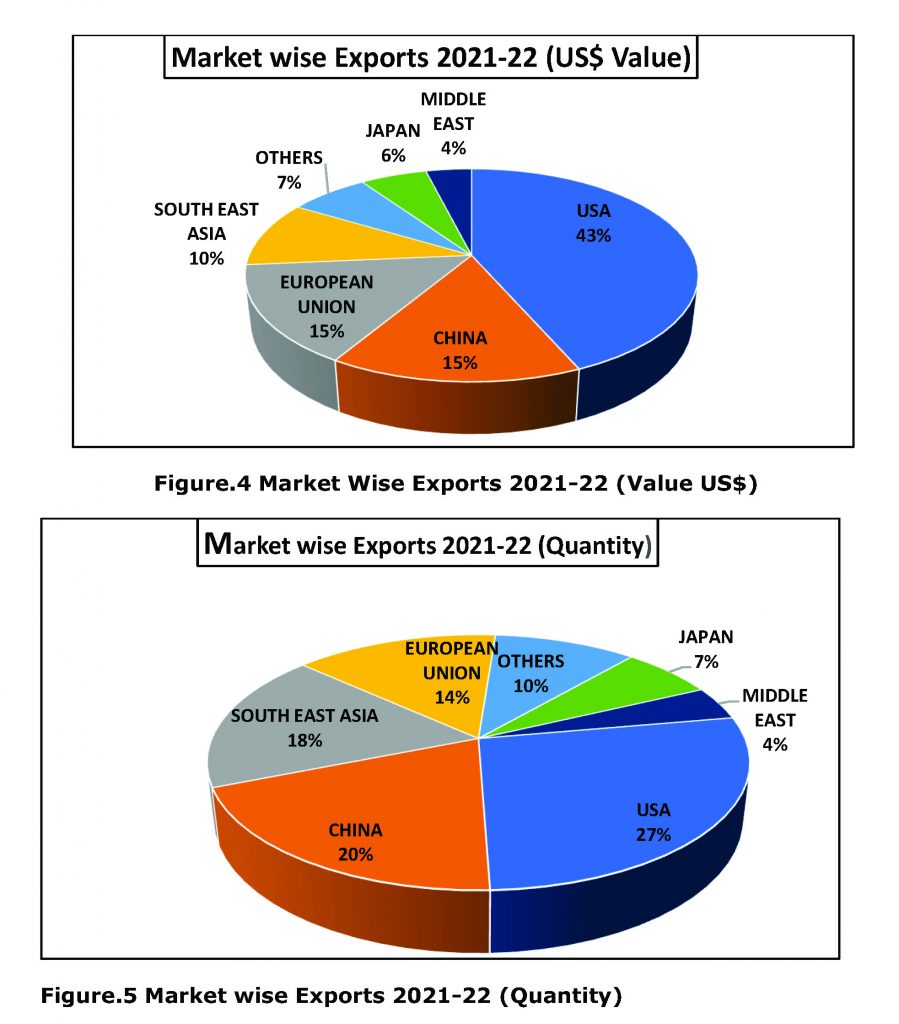
Market wise export Details
India exported marine products to 123 countries
USA retained the title as the major importer of Indian seafood with a share of 43.45% in terms of USD. USA imported 3,72,611 MT of seafood in the current financial year. Export to USA has showed a growth of 37.56%, 36.76% and 27.63% in US$ value, rupee value and quantity terms. Frozen Shrimp continued to be the principal item exported to USA with a share of 93.33% in USD value. Exports of Vannamei shrimp to USA showed a growth of 34.65% in USD terms, 33.94% in rupee value and 26.81% in quantity. The Black Tiger Shrimp exports to USA also increased by 68.99%, 151.78% and 152.06% in terms of Quantity, rupee value and USD terms respectively.
China continued to be the second largest market destination for Indian Seafood with a share of 15.14% in USD earnings and 19.5% in quantity terms. China imported 2,66,989 MT of Seafood worth USD 1175.05 million. The export to China has shown a positive trend of 31.09%, 25.12% and 22.28% in rupee value, USD and quantity terms respectively. Frozen Shrimp is the major item of exports to China accounting a share of 47.07% in quantity and 67.04% in USD earnings.
European Union continued to be the third largest destination for Indian Seafood with a share of 14.98% in USD. The export to EU has shown a positive trend of 42.29%, 41.41% and 29.92% in rupee value, USD terms and quantity respectively. Frozen Shrimp continued to be the major item of exports to EU accounting for a share of 45.62% in quantity and 56.59% in USD earnings out of the total exports to EU. Export of frozen shrimp to EU increased by 37.09% and 29.11% in USD value and quantity.
South East Asia is the fourth largest market destination of Indian Marine products accounting for a share of 10.04% in USD terms. The export to South East Asia has shown a positive trend of 17.88%, 17.08% and 11.80% in rupee value, USD terms and quantity respectively. Fr. Shrimp is major item in this market with share of 36.81% with growth of 22.29% in USD terms.
Japan is the fifth largest destination for Indian Seafood with a share of 5.68% in USD earnings and 6.60% in quantity terms. Exports to Japan have shown a positive growth of 6.95% in US$ value term, 6.91% in rupee value terms and 4.02% in quantity terms. Frozen Shrimp continued to be the major item of exports to Japan accounting a share of 74.55% in USD earnings and 42.62% in quantity. Exports of Frozen shrimp to Japan increased by 3.73% in USD and 3.33% in rupee terms.
Middle East is the sixth largest destination for Indian Seafood with a share of 3.91% in USD value terms. This market has shown an increase of 21.27%, 20.70% and 20.20% by rupee value, USD value, and in quantity terms respectively. Frozen Shrimp continued to be the major item of exports to Middle East accounting a share of 76% in USD earnings with growth of 27%.
Other Countries showed an increase of 35.57%, 26.79% and 4.29% in rupee value, USD value and quantity respectively. The other countries export basket contributed to a share of 6.8% in USD terms. Among other countries Canada (36.21%), Russia (19.46%), Bangladesh (5.34%), Dominican Republic (5.16%), Tunisia (4.56%), together contributed 70.72% in USD terms. In the cluster of other countries also Fr. Shrimp was major item with export share of 74.05% and growth of 35.30% by US$ terms.
The details on major markets for Indian marine products are given in the Table. 5
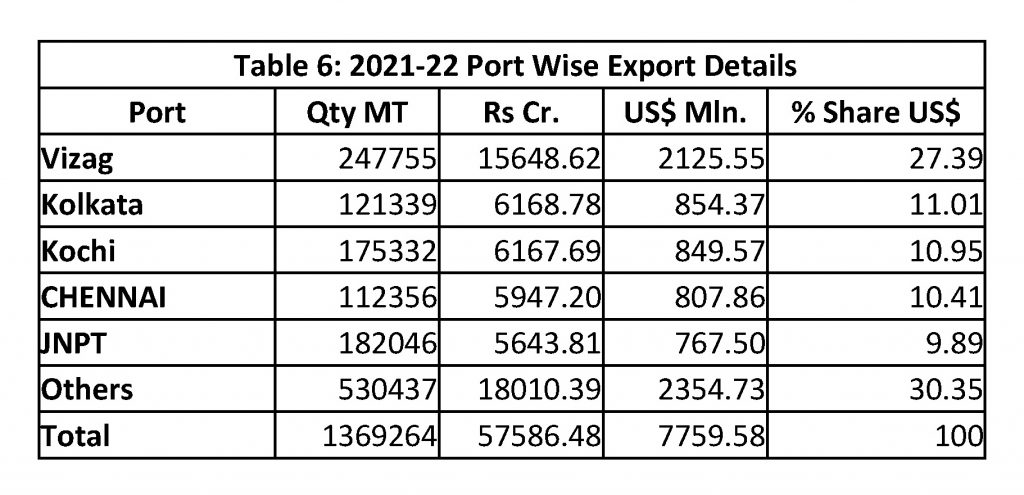
Major Port wise Exports
The top 5 ports which handled marine products cargo in 2021-22 were Vizag, Kolkata, Kochi, Chennai and JNPT contributed 69.65% share in US$ terms.
The details are shown in table 6 below:
Outlook for 2022-23
Department of Commerce has fixed an ambitious target of US$ 8,868 million for marine products export for 2022-23, which require a growth rate of about 15% over the previous year to achieve the target.
********